Visualisation for Intrusion Detection system
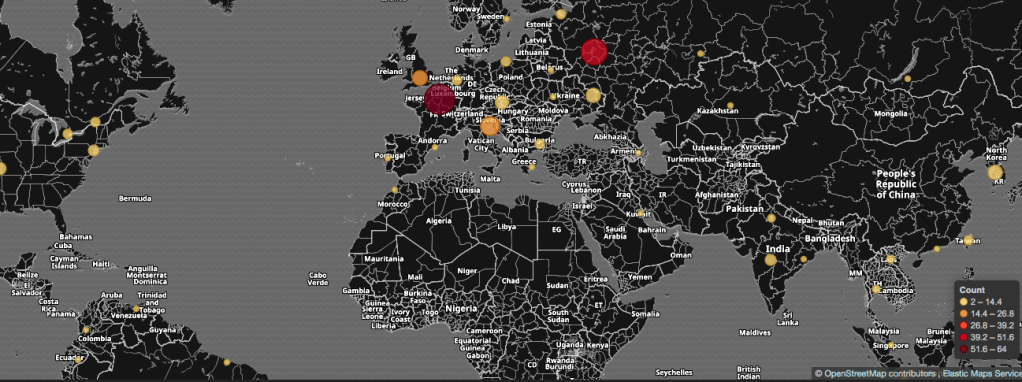
I have just finished building a portal with some visualisation for Intrusion Detection system. On one of the panels you can see analysis of sources of malicious traffic by geographical distribution. What I have seen there, didn’t surprise me but the customer was shocked. He looked at the map below and said – “it must be wrong – your portal shows traffic only from China.”
Well, I have excluded China from the graph and we got a completely different map. You can see other countries “participation” in attacks.

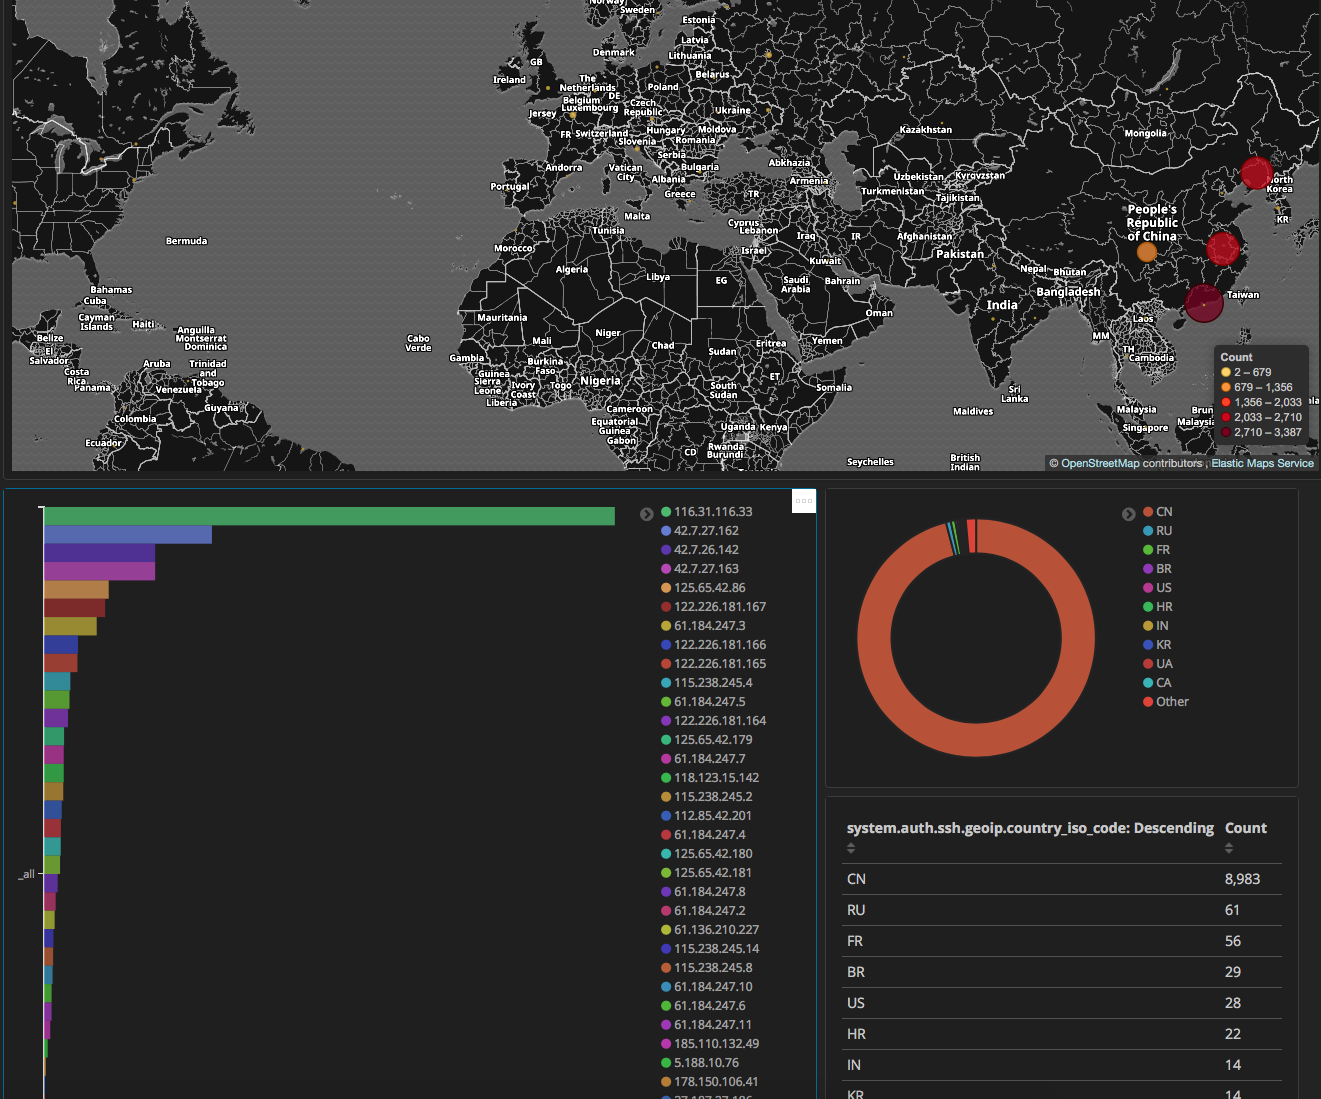
For those who are interested in numbers, I am including a precise picture including number of brute force login attacks for the last 24 hours – as you can see someone is very busy.
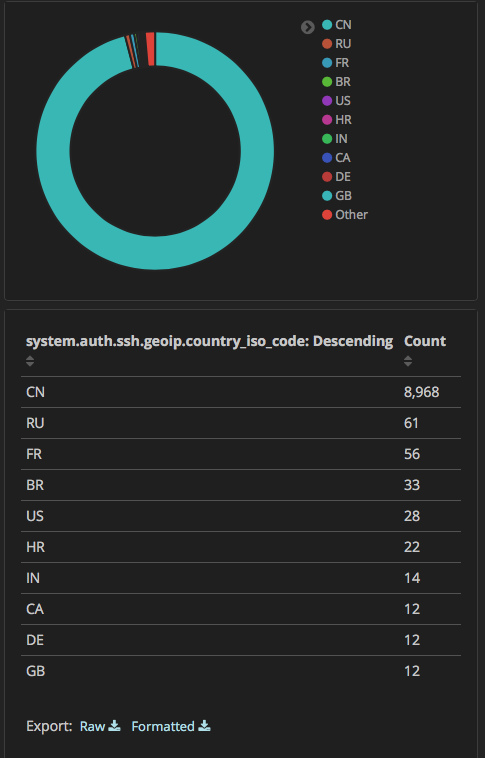
As I have already mentioned – those numbers didn’t surprised me as I see it every day in our threat hunting lab when collecting data from the honey pot network. Frequency of automatic attacks bots originating from China is astonishing, it cannot be matched with any other countries.
Just today I have come across an article by Patrick Wardle about an application Adware Doctor, which supposed to protect users from AddWare, however, it had one other function – it was sending user data to China – should this not be a concern for Data Protection watchdog organisations across EU member states as GDPR is in force?
If you are concerned about safety of your applications, or web services in your organisation please contact us and we will do everything we can to help.

You must be logged in to post a comment.